Active Shooter Statistics
In 2013, the FBI began its initial review of active shooter incidents. The FBI defines an “active shooter” as one or more individuals actively engaged in killing or attempting to kill people in a populated area. Implicit in this definition is the shooter’s use of one or more firearms. The “active” aspect of the definition inherently implies the ongoing nature of the incidents, and thus the potential for the response to affect the outcome.
In 2014, the FBI published its first report, A Study of Active Shooter Incidents Between 2000-2013, and subsequently
published annual and bi-annual reports reflecting its continued research into active shooter incidents based on the FBI’s
definition of an active shooter.
In 2019 the FBI produced a 20-Year Active Shooter Summary.
Active Shooter Incidents
In the U.S. between 2000 and 2019 the FBI identified 333 incidents
involving 345 shooters.
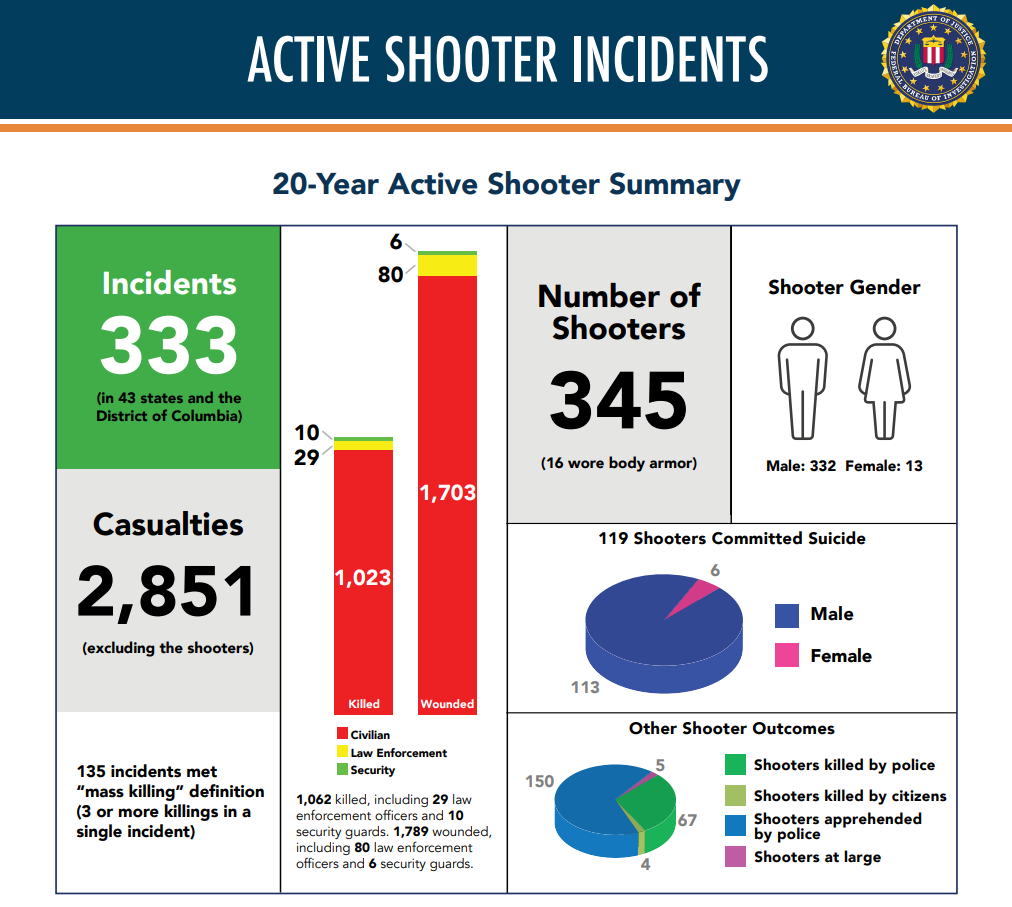
Active Shooter Casualties
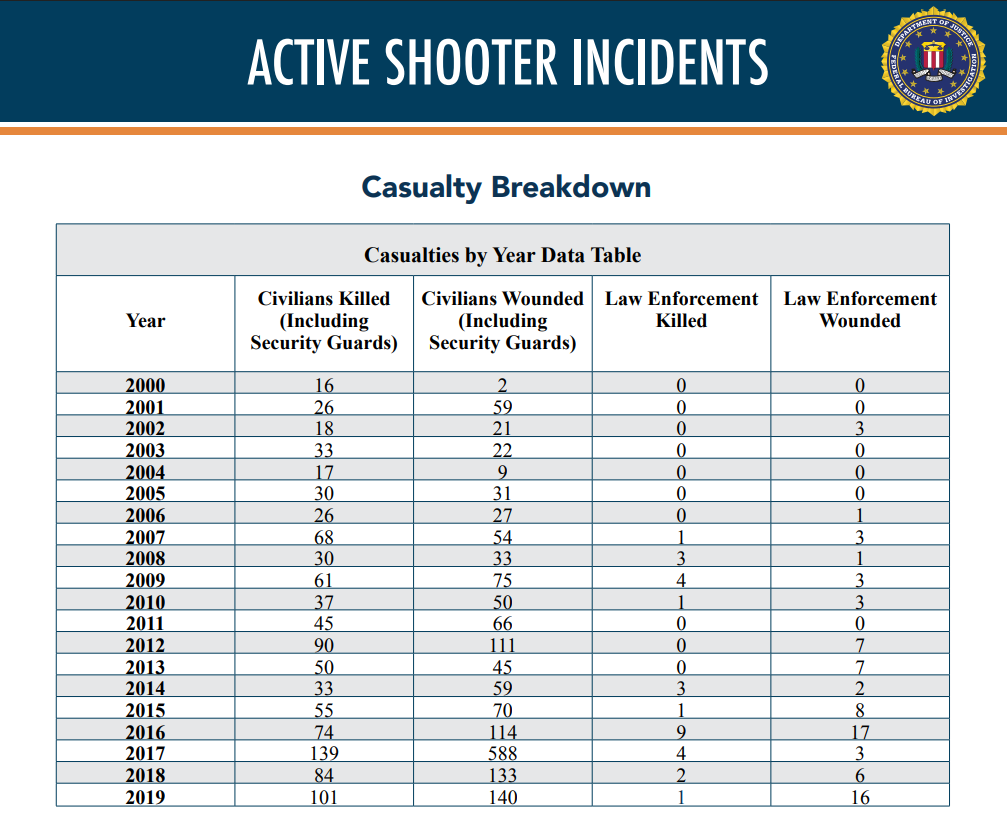
The 333 active shooter incidents resulted in 2,851 casualties between 2000-2019, including 109 law enforcement and 16
security personnel.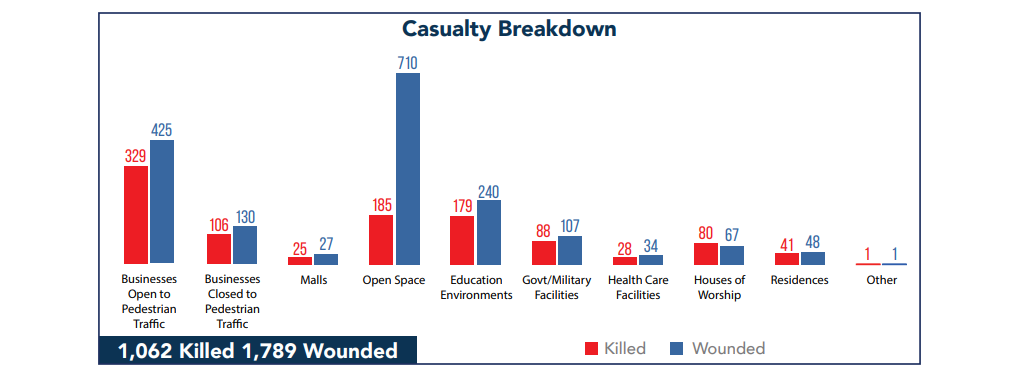
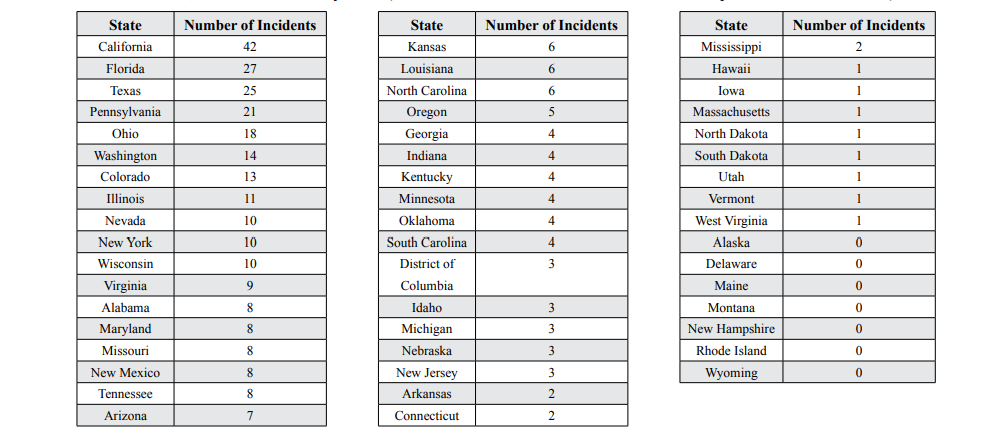
Active Shooter Locations
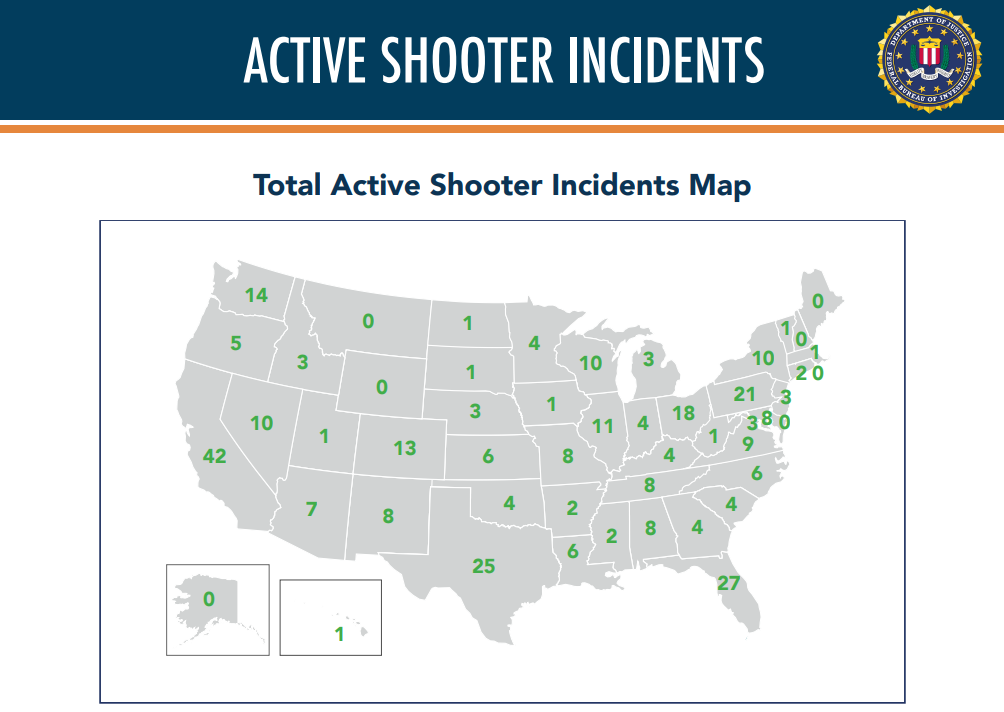
Between 2000-2019, active shooter incidents occurred in 43 states and the District of Columbia. California (42), Florida (27), Texas (25), and Pennsylvania (21) had the highest number of active shooter incidents. When an incident occurred in two or more states, it was counted only once (in the state where the FBI identified that the public was most at risk).
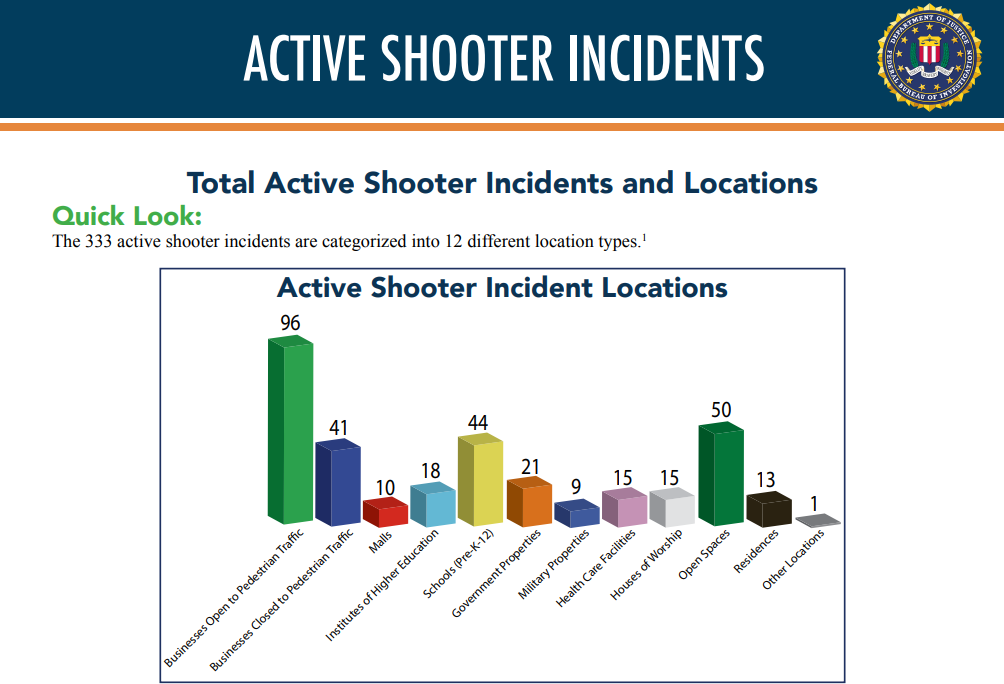
Between 2000-2019, Businesses open to pedestrian traffic had the highest number of incidents with 96, followed by open spaces with 50, and
schools (Pre-K-12) with 44.
Ten incidents involved multiple shooters, and half of those incidents occurred in businesses open to pedestrian traffic. The
other five incidents involving multiple shooters occurred in four different location types: a residence, institutes of higher
education, a school (Pre-K-12), and open spaces (neighborhood streets).
In all, 44 of the 333 incidents involved shootings at two or more locations (incidents were categorized by the location
where the public was most at risk).
Shooters’ Weapons
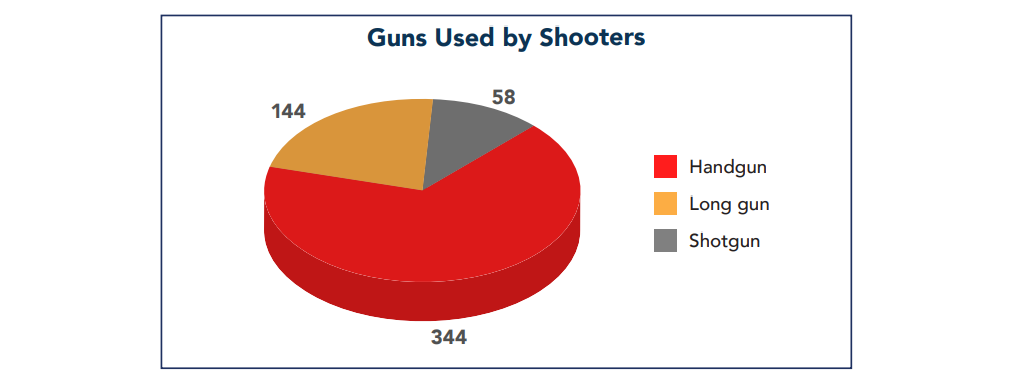
Between 2000-2019, In the 333 active shooter incidents, handguns accounted for 67% of the weapons used, 38% of the 345 shooters had
multiple weapons, 5% wore body armor, and 4% had access to or deployed additional devices.
Single/Multiple Firearms: Two hundred fourteen shooters carried a single firearm in 205 incidents; 131 shooters carried multiple firearms in 128
incidents.
Additional Devices: Twelve shooters (in 11 incidents) had access to or deployed additional devices (e.g., improvised explosive devices,
incendiary devices, smoke grenades, tear gas canisters).
Body Armor: Sixteen shooters wore body armor (five at open spaces, four at business open to pedestrian traffic, three at government
properties, two at high schools, and two at institutes of higher education).
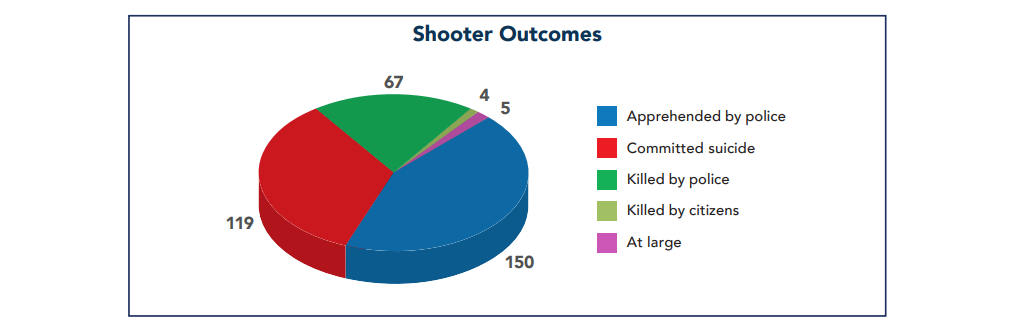
Shooter Outcomes
Between 2000-2019, of the 345 active shooters, 186 died by suicide or were killed by police and 150 were apprehended by police. Since 2016, apprehension by law enforcement was the most likely outcome.
Source: Active Shooter Incidents 20-Year Review, 2000-2019, Federal Bureau of
Investigation, U.S. Department of Justice, Washington, D.C.
RECENT FINDINGS
The most recent findings below, show an overview of active shooter incidents during 2023.
In 2023, the FBI designated 48 shootings as active shooter incidents. Although incidents decreased by 4% from 2022 (50 incidents), the number of active shooter incidents increased by 60% since 2019 (30 incidents)
The 48 active shooter incidents in 2023 occurred in 26 states and represent five location categories: open space, commerce, education, health care, and residence.
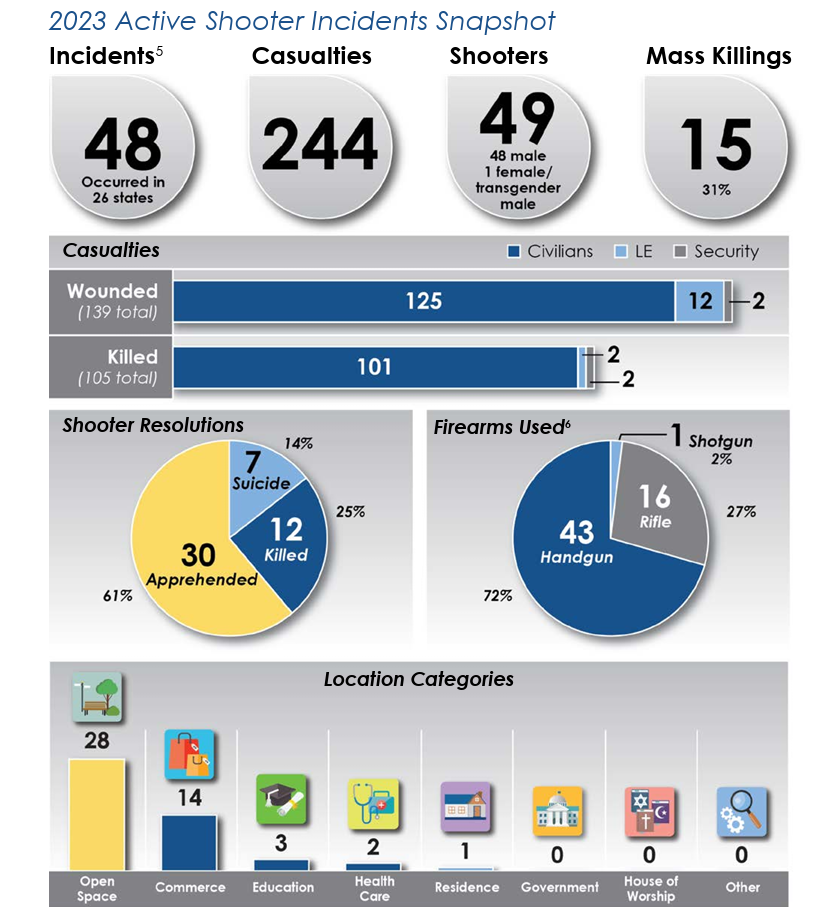
Additional active shooter incident key findings include:
• There were 244 casualties (105 killed and 139 wounded).
• Two law enforcement officers were killed and 12 were wounded.
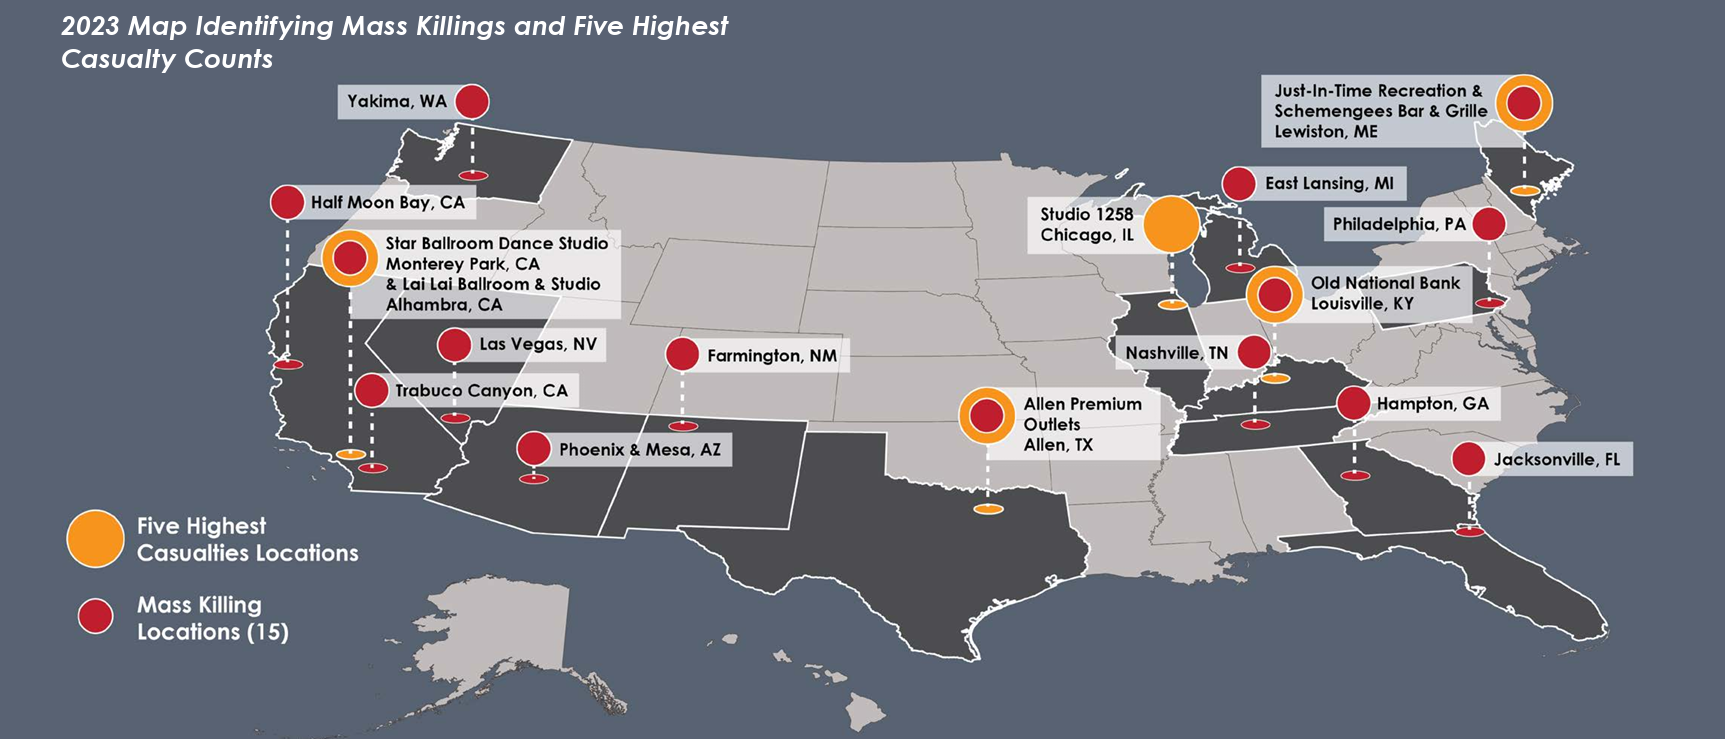
• In the incident with the highest number of casualties (31), 18 were killed and 13 wounded.
• In three incidents, there were zero casualties.
• California had the most incidents (eight), followed by Texas and Washington, each with four incidents.
• April had the highest number of incidents (seven), with January having the second highest number of incidents (six).
• Incidents occurred every day of the week, with Monday having the highest number of incidents (11).
• Incidents were more likely to occur between noon and 11:59 p.m.
• Fifteen incidents met the federal definition for a mass killing incident.
• Based on location, 28 incidents (58%) occurred in open spaces, followed by 14 in commerce (29%), three in education (6%), two in health care (4%), and one in residence (2%).
• There were 24 incidents (50%) that involved multiple locations (19 in open spaces and five in commerce).
• Of the 49 shooters, 48 were male (98%) and one identified as both female and transgender male (2%).
• Shooters were between the ages of 17 and 72 years old.
• In 48 incidents, 60 firearms were used by shooters—43 handguns, 16 rifles, and one shotgun.
• Of the 48 incidents, four involved an insider threat (8%).
• Of the 49 shooters, five wore body armor (10%).
• Of the 49 shooters, 30 were apprehended by law enforcement (61%), 12 were killed by law enforcement (25%), and seven died by suicide (14%).
• In 20 incidents (42%), there was an identified connection between the shooter and the location and/or at least one victim, whereas in 28 incidents (58%), no connection was identified.
Source: Active Shooter Incidents in the United States, 2023, Federal Bureau of Investigation, U.S. Department of Justice, Washington, D.C., and the Advanced Law Enforcement Rapid Response Training (ALERRT) Center at Texas State University, published 2024
Commenting is not enabled on this course.